
Prometheus 监控 Kubernetes ETCD 集群
文章目录
!版权声明:本博客内容均为原创,每篇博文作为知识积累,写博不易,转载请注明出处。
系统环境:
- 操作系统: CentOS 7.9
- Docker 版本: 20.10.8
- Prometheus 版本: 2.29.1
- Kubernetes 版本: 1.20.2
系列文章目录
- 01. Kubernetes 部署监控工具 Prometheus
- 02. Kubernetes 部署图表工具 Grafana
- 03. Prometheus 结合 Node Exporter 监控 Kubernetes 集群节点
- 04. Prometheus 结合 StateMetrics+cAdvisor 监控 Kubernetes 集群服务
- 05. Prometheus 监听指定标签 Kubernetes 服务
- 06. Prometheus 监控 Kubernetes ETCD 集群
- 07. Prometheus Exporter 黑盒监控 Kubernetes 服务
- 08. Kubernetes 部署告警工具 AlertManager
- 09. AlertManager 配置邮箱告警
- 其它章节整理中...
一、什么是 ETCD
ETCD 是一个高可用的键值对数据库,在 Kubernetes 中,所有资源的信息都会存储到 ETCD 集群中进行存储,如果 ETCD 不可用将会导致 Kubernetes 集群瘫痪,所以监控 ETCD 集群尤为重要。
二、如何采集 ETCD 指标数据
在 Kubernetes 集群的 ETCD 默认是开启暴露 metrics 数据的,不过一般来说 ETCD 部署在集群外,并且其暴露的接口是基于 HTTPS 协议。为了统一管理,我们需要将 ETCD 服务代理到 Kubernetes 集群中,然后使用 Prometheus 的 Kubernetes 动态服务发现机制,自动查找到带有指定 label 标签的 ETCD Service 服务。
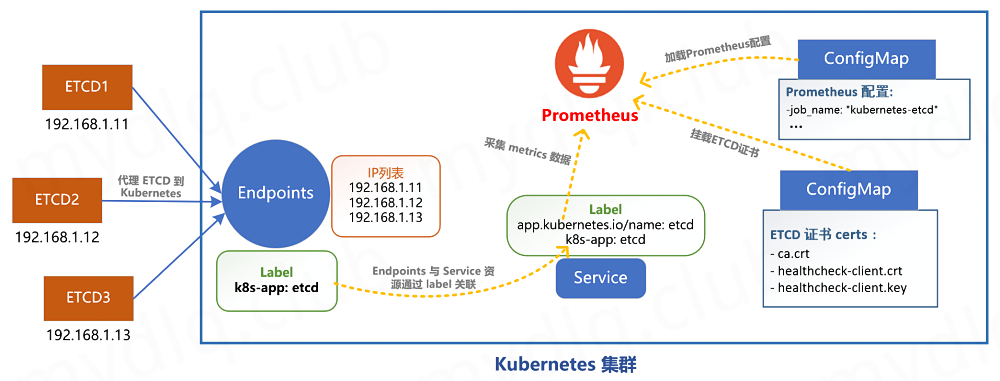
三、将 ETCD 服务代理到 Kubernetes 集群
实现 Prometheus 第一步,我们首先需要创建 ETCD 的 Service 和 Endpoints 资源,将 ETCD 代理到 Kubernetes 集群内部,然后给 ETCD Service 添加指定 labels 标签 app.kubernetes.io/name: etcd,这样后续 Prometheus 会通过 Kubernetes 服务发现机制,查找到带有此标签的 Service 关联的应用列表。
将 ETCD 代理到 Kubernetes 的 Endpoints 和 Service 资源配置文件 etcd-proxy.yaml 内容如下:
 1apiVersion: v1
 2kind: Service
 3metadata:
 4  name: etcd-k8s
 5  namespace: kube-system
 6  labels:
 7    k8s-app: etcd                 ## Kubernetes 会根据该标签和 Endpoints 资源关联
 8    app.kubernetes.io/name: etcd  ## Prometheus 会根据该标签服务发现到该服务
 9spec:
10  type: ClusterIP
11  clusterIP: None                 ## 设置为 None,不分配 Service IP
12  ports:
13  - name: port
14    port: 2379
15    protocol: TCP
16---
17apiVersion: v1
18kind: Endpoints
19metadata:
20  name: etcd-k8s
21  namespace: kube-system
22  labels:
23    k8s-app: etcd
24subsets:
25- addresses:                      ## 代理的应用IP地址列表
26  - ip: 192.168.2.31
27  ports:
28  - port: 2379                    ## 代理的应用端口号
四、Prometheus 挂入 ETCD 证书文件
由于 ETCD 是基于 HTTPS 协议,Prometheus 采集指标数据时需要使用 TLS 证书,所以我们需要将 ETCD 的证书文件挂载到 Kubernetes 集群的 ConfigMap 资源中。创建完后需要修改 Prometheus 部署资源的挂载配置,将证书 ConfigMap 挂载到 Prometheus 容器中。
将 ETCD 证书文件存入 CongfigMap
进入 ETCD 所在的服务器,将 ETCD 证书文件挂载到 Kubernetes 的 ConfigMap 资源中,执行的命令如下:
- -n: 命令空间。
- --from-file: 读取指定文件,生成 ConfigMap 资源。
1$ kubectl create secret generic etcd-certs \
2  --from-file=/etc/kubernetes/pki/etcd/healthcheck-client.crt \
3  --from-file=/etc/kubernetes/pki/etcd/healthcheck-client.key \
4  --from-file=/etc/kubernetes/pki/etcd/ca.crt \
5  -n kube-system
注: 本人是使用 kubeadm 安装的 Kubernetes 集群,默认 ETCD 证书会放到
/etc/kubernetes/pki/etcd/目录下。
修改 Prometheus 部署参数
接下来我们修改 Prometheus 部署资源配置,添加挂载 ETCD 证书参数,将证书文件挂入 Prometheus 应用中,内容如下:
  1apiVersion: v1
  2kind: Service
  3metadata:
  4  name: prometheus
  5  labels:
  6    k8s-app: prometheus
  7spec:
  8  type: NodePort
  9  ports:
 10  - name: http
 11    port: 9090
 12    targetPort: 9090
 13    nodePort: 30900
 14  selector:
 15    k8s-app: prometheus
 16---
 17apiVersion: apps/v1
 18kind: Deployment
 19metadata:
 20  name: prometheus
 21  labels:
 22    k8s-app: prometheus
 23spec:
 24  replicas: 1
 25  selector:
 26    matchLabels:
 27      k8s-app: prometheus
 28  template:
 29    metadata:
 30      labels:
 31        k8s-app: prometheus
 32    spec:
 33      serviceAccountName: prometheus
 34      containers:
 35      - name: prometheus
 36        image: prom/prometheus:v2.26.0
 37        ports:
 38        - name: http
 39          containerPort: 9090
 40        securityContext:
 41          runAsUser: 65534
 42          privileged: true
 43        command:
 44        - "/bin/prometheus"
 45        args:
 46        - "--config.file=/etc/prometheus/prometheus.yml"
 47        - "--web.enable-lifecycle"
 48        - "--storage.tsdb.path=/prometheus"
 49        - "--storage.tsdb.retention.time=10d"
 50        - "--web.console.libraries=/etc/prometheus/console_libraries"
 51        - "--web.console.templates=/etc/prometheus/consoles"
 52        resources:
 53          limits:
 54            cpu: 2000m
 55            memory: 1024Mi
 56          requests:
 57            cpu: 1000m
 58            memory: 512Mi
 59        readinessProbe:
 60          httpGet:
 61            path: /-/ready
 62            port: 9090
 63          initialDelaySeconds: 5
 64          timeoutSeconds: 10
 65        livenessProbe:
 66          httpGet:
 67            path: /-/healthy
 68            port: 9090
 69          initialDelaySeconds: 30
 70          timeoutSeconds: 30
 71        volumeMounts:
 72        - name: data
 73          mountPath: /prometheus
 74          subPath: prometheus
 75        - name: config
 76          mountPath: /etc/prometheus
 77        - name: certs            #### 将ETCD证书的ConfigMap挂进Prometheus容器
 78          readOnly: true
 79          mountPath: /certs
 80      - name: configmap-reload
 81        image: jimmidyson/configmap-reload:v0.5.0
 82        args:
 83        - "--volume-dir=/etc/config"
 84        - "--webhook-url=http://localhost:9090/-/reload"
 85        resources:
 86          limits:
 87            cpu: 100m
 88            memory: 100Mi
 89          requests:
 90            cpu: 10m
 91            memory: 10Mi
 92        volumeMounts:
 93        - name: config
 94          mountPath: /etc/config
 95          readOnly: true
 96      volumes:
 97      - name: data
 98        persistentVolumeClaim:
 99          claimName: prometheus
100      - name: config
101        configMap:
102          name: prometheus-config
103      - name: certs               #### 将ETCD证书的ConfigMap挂进Prometheus容器
104        secret:
105          secretName: etcd-certs
五、Prometheus 添加采集 ETCD 的配置
创建 Prometheus 采集 ETCD 的配置
接下来我们创建 Prometheus 采集 ETCD 的配置,在配置中需要指定使用的 TLS 证书参数和 Kubernetes 服务发现机制,配置内容如下:
 1###################### kubernetes-etcd ######################
 2- job_name: "kubernetes-etcd"
 3  scheme: https
 4  tls_config:
 5    ## 配置 ETCD 证书所在路径(Prometheus 容器内的文件路径)
 6    ca_file: /certs/ca.crt
 7    cert_file: /certs/healthcheck-client.crt
 8    key_file: /certs/healthcheck-client.key
 9    insecure_skip_verify: false
10  kubernetes_sd_configs:
11  ## 配置服务发现机制,指定 ETCD Service 所在的Namespace名称
12  - role: endpoints
13    namespaces:
14      names: ["kube-system"]
15  relabel_configs:
16  ## 指定从 app.kubernetes.io/name 标签等于 etcd 的 service 服务获取指标信息
17  - action: keep
18    source_labels: [__meta_kubernetes_service_label_app_kubernetes_io_name]
19    regex: etcd
将 ETCD 采集配置写入 Prometheus 的 ConfigMap
在之前介绍过 在 Kubernetes 中如何部署 Prometheus,且将部署过程中将 Prometheus 配置参数写到了 ConfigMap 资源中,通过挂载 ConfigMap 到 Prometheus Pod 内,这样修改 ConfigMap 就可以修改 Prometheus 配置。
这里将上面 Prometheus 中的配置参数写到 Kubernetes 中的 ConfigMap 资源 prometheus-config.yaml 中,内容如下:
 1kind: ConfigMap
 2apiVersion: v1
 3metadata:
 4  name: prometheus-config
 5  namespace: kube-system
 6data:
 7  prometheus.yml: |
 8    global:
 9      scrape_interval:     15s
10      evaluation_interval: 15s
11      external_labels:
12        cluster: "kubernetes"
13    scrape_configs:
14    ###################### kubernetes-etcd ######################
15    - job_name: "kubernetes-etcd"
16      scheme: https
17      tls_config:
18        ca_file: /certs/ca.crt
19        cert_file: /certs/healthcheck-client.crt
20        key_file: /certs/healthcheck-client.key
21        insecure_skip_verify: false
22      kubernetes_sd_configs:
23      - role: endpoints
24        namespaces:
25          names: ["kube-system"]
26      relabel_configs:
27      - action: keep
28        source_labels: [__meta_kubernetes_service_label_app_kubernetes_io_name]
29        regex: etcd
Prometheus 重新加载配置
为了使 Prometheus 重新加载配置,我们执行下面命令,使其重新读取 ConfigMap 资源中的配置参数:
- -f: 指定要部署的资源文件。
- -n: 指定 Namespace 名称。
1$ kubectl apply -f prometheus-config.yaml -n kube-system
配置修改后需要使 Prometheus 重新加载 ConfigMap 中的参数配置,执行命令如下:
1$ curl -XPOST http://192.168.2.32:30900/-/reload
注: 这里本人的 Prometheus 地址是 http://192.168.2.32:30900
观察 Prometheus UI 中 ETCD 采集项的状态
重新加载 Prometheus 的配置后,我们打开它的 UI 界面,查看 Targets 一栏中是否存在 ETCD 采集目标记录,并且检测状态是否正常,界面内容如下图所示。

如果看到 ETCD 采集规则显示正常,则说明采集配置没有问题,否则检测上面步骤是否正确。
注: 因为本人测试环境只有一个 ETCD 节点,所以上面显示数量为 1,如果 ETCD 有三台组成高可用,那么采集的节点数量将是 3。
六、Grafana 中引入 ETCD 监控看板
在之前的 "Kubernetes 部署图表组件 Grafana" 文章中,已经介绍过如何在 Kubernetes 中部署 Grafana,并且在之前的项目中也介绍了 Grafana 如何引入 Prometheus 数据库,所以这里就不介绍该组件的安装和数据库配置过程,只是简单介绍下如何引入 ETCD 监控看板界面,操作过程如下:
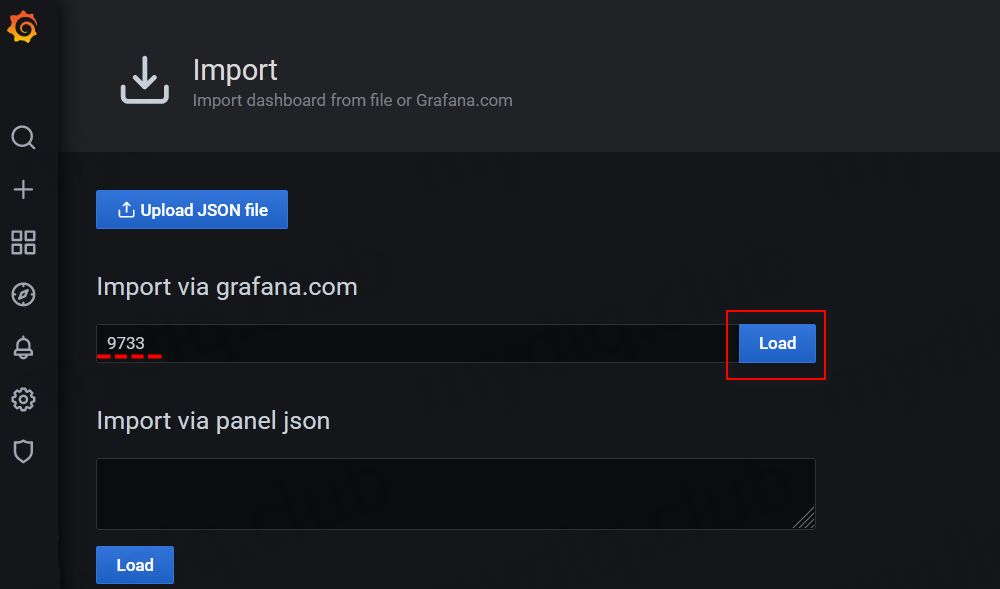
(1) 打开 Grafana Dashboard,然后点击 Manage 后选择 Import 按钮,引入新的监控看板。
(2) 在 Import via grafana.com ID 一栏输入看板 ID 值 9733,引入 ETCD 的 Dashboard 看板。
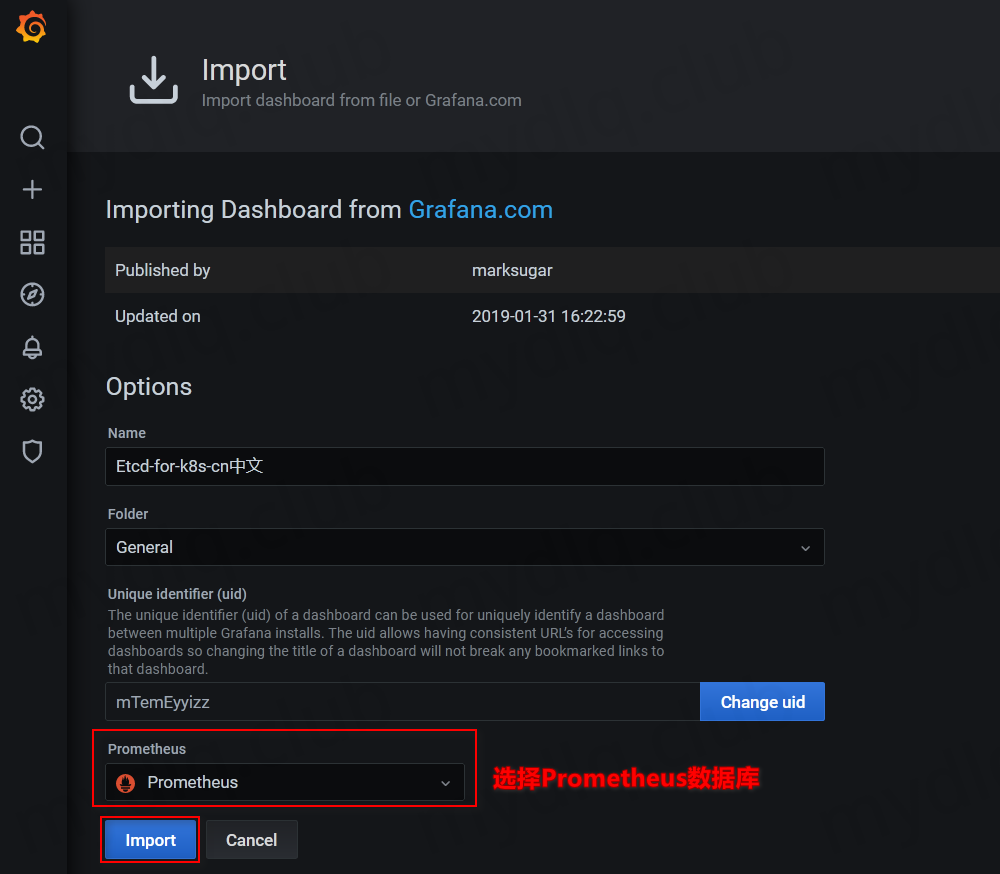
(3) 选择 Prometheus 数据库,然后点击 Import 加载看板。
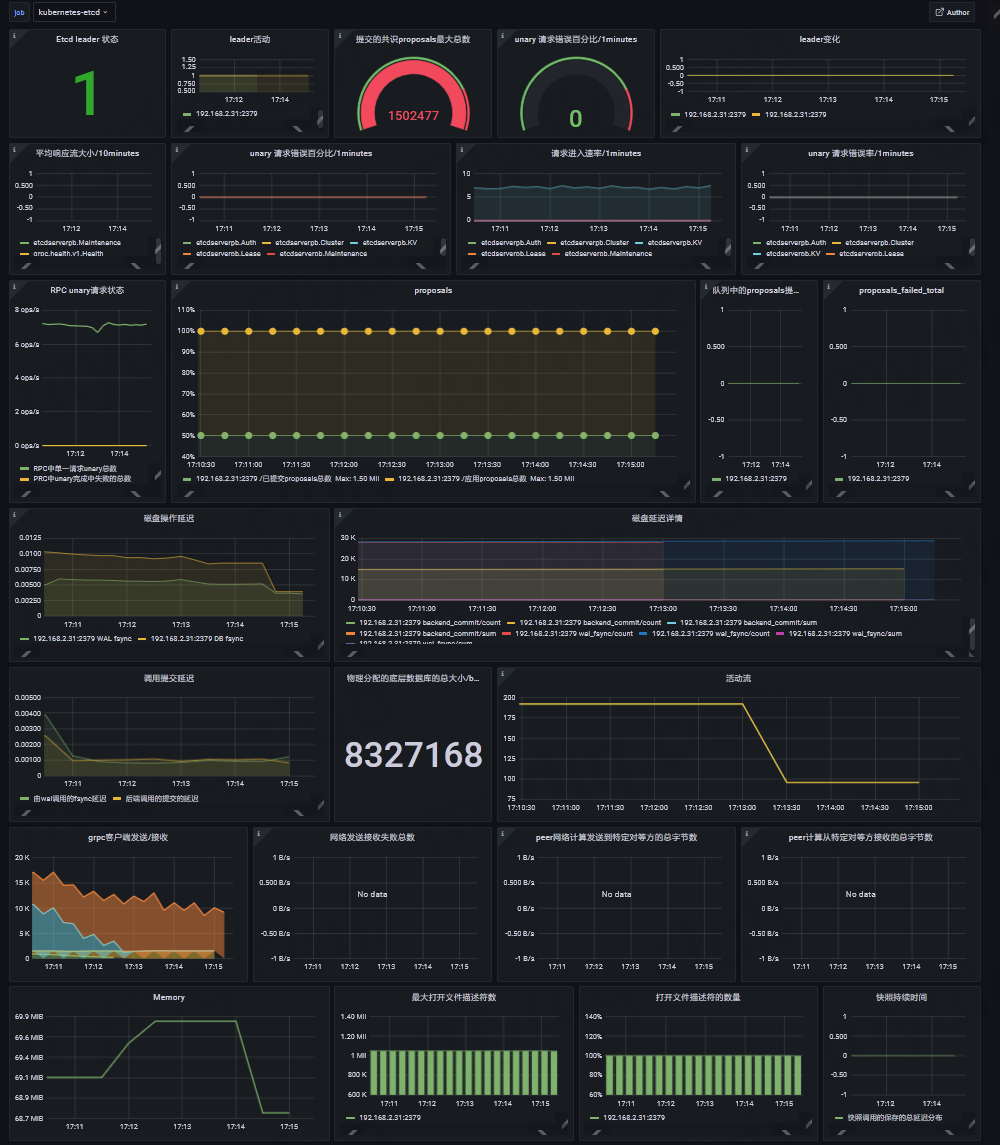
可以看到 ETCD 看板成功显示其监控的相关数据信息,显示的信息如下图。

---END---
如果本文对你有帮助,可以关注我的公众号"小豆丁技术栈"了解最新动态,顺便也请帮忙 github 点颗星哦~感谢~

!版权声明:本博客内容均为原创,每篇博文作为知识积累,写博不易,转载请注明出处。